
The quantity of raw material that must be purchased and the best time to purchase can be experimentally determined. The trend over time of the inventory level can be represented with a graph like the one shown below:
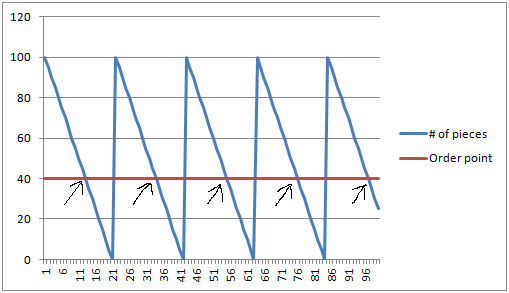
where the points indicated by the arrows indicate the moment in which to order the goods and the diff between max and min is the quantity to be ordered.